Dashboard
Every day we pull the latest buy/sell quotes for physical gold and silver coins and bars from major dealers around the world, calculate the true average, and update these charts.
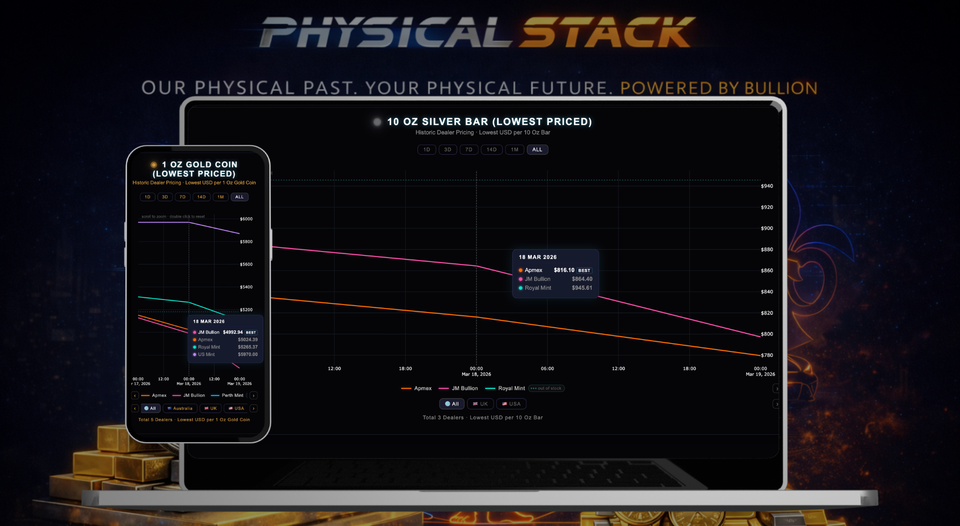
What You’re Looking At
- Main Physical Retail Chart — Daily averaged price across dealers (with min/max shaded band)
- Average Physical Premium Over Spot — How much extra you’re actually paying right now
- Retail Spread vs Western/Shanghai/India Spot — Shows how dealer pricing diverges from the paper markets
- Physical Ratios — Physical Silver vs SPX and other useful comparisons
Data is updated daily (at US spot market open).
All charts are interactive — hover, zoom, filter by product, toggle dealers on/off.
Use this intelligence to time your buys, track premiums, and understand when the physical market is running hot or cold.
Your $1/month membership gives you full access to everything here plus weekly email summaries.
Our members save on average +$1-$3 every time they buy a single gold and silver product by picking the best spread in the retail market using our charts.
Need a specific product added or a custom ratio? Just reply to any member email and we’ll consider it for the next update.
Welcome to the real physical market.